One of the greatest obstacles to social platform regulation is the lack of data that could help both policymakers and the public understand the platforms’ innate biases. From greater visibility into their moderation and fact-checking efforts to a deeper understanding of the algorithms that determine what goes viral, the lack of hard data on platforms’ internal operations hamstrings attempts to rein in their power. A closer look at Twitter reminds us that we don’t even know the most basic of details, including how many users or posts per day it has, which begs the question of how Congress could possibly regulate these platforms absent such elemental information.
Just how big is Twitter?
The social media giant no longer publishes regular statistics on how many users actually post to its platform each day or how much they share (it instead reports self-defined metrics such as “monthly active users”). Other determinations hinge on these details: Is Twitter fading toward irrelevance or is its growth accelerating across the world? Is it a place for ordinary people to tell their stories or mostly a place for journalists to retweet celebrities and politicians? These are fundamental questions at the heart of any regulation attempts, yet the company remains silent when asked about them.
Thankfully, Twitter makes several data feeds available of its platform, making it possible to externally audit key statistics about its growth and usage. While only select companies have access to all tweets, the company makes widely available a random sample of 1% of all tweets sent each day. Comparison of this 1% dataset against the full Twitter dataset last year showed that the two are perfectly correlated, meaning it can be used to report on key trends from the outside.
Using a copy of this 1% dataset compiled from January 2012 through June 2020, what can we learn about Twitter’s evolution over the past eight years, and especially how it is changing in the COVID-19 era?
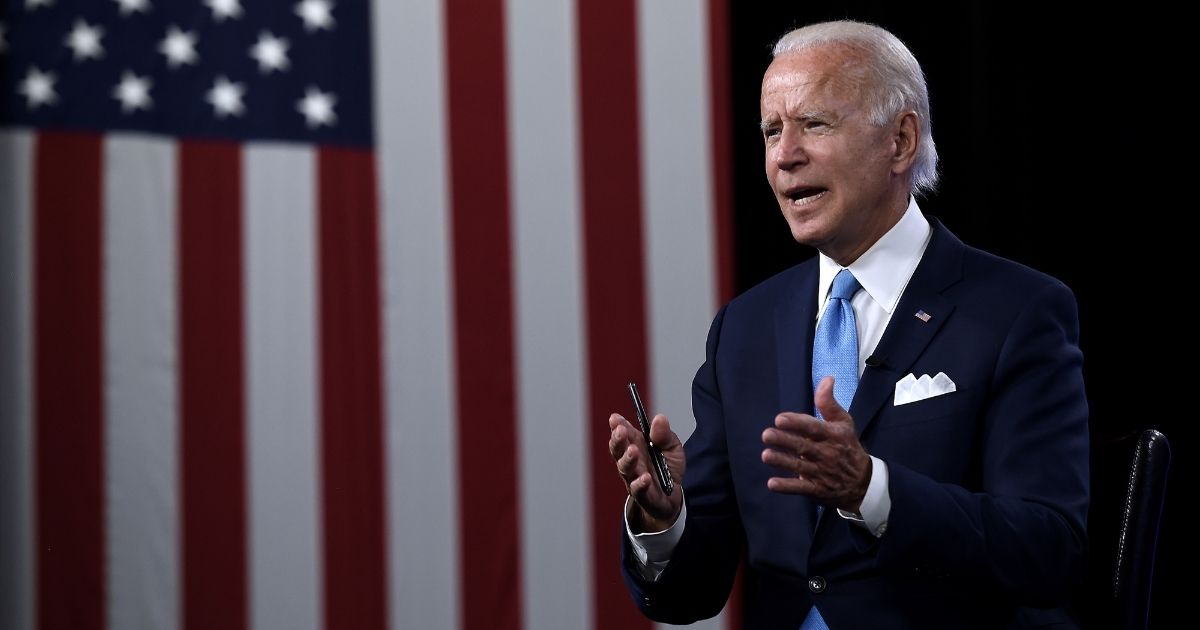
The timeline below shows the total number of tweets sent each day over that period, estimated from the sampled dataset (holes are areas where data collection failed due to technical issues). (Click to enlarge the image.)
The platform had actually been on a decline in recent years, falling from a peak of nearly 500 million tweets a day in July 2013 to just over 320M/day in November 2018, but was recovering when the pandemic caused a marked surge in usage. The spread of widespread global lockdowns March 12-30 this year caused use of Twitter to explode to nearly 500M tweets a day, with usage ranging from gaming to events, thus returning traffic to the platform’s July 2013 peak.
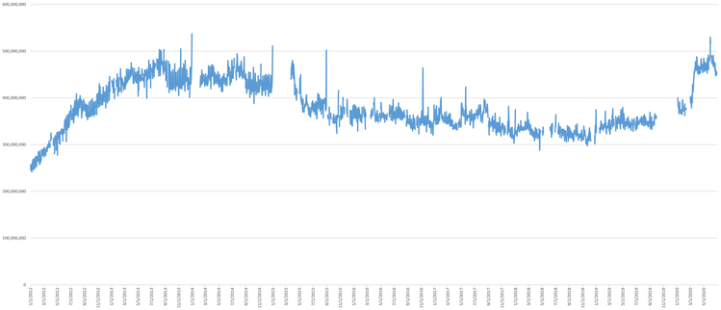
Similarly, the timeline below estimates the number of users sending one or more tweets each day. This differs from their own active user counts in that this graph charts only users actually sending tweets, rather than also including those who view tweets but don’t contribute themselves.
While many industries have been decimated by lockdowns, social platforms have thrived.
Though verified users make up just a tiny fraction of all Twitter users, they are highly influential, with around 10% of all tweets each day being a verified account’s tweet or an ordinary user’s retweet of a verified tweet. That number has been stable since around July 2017 and remains unchanged during the pandemic, suggesting that verified public health accounts are not driving the COVID-19 conversation. Instead, there has been an influx of new users to Twitter during the pandemic who are adding their own commentary rather than amplifying that of influencers.
Sharing of links on Twitter has dropped significantly during the pandemic following an already established three-year decline, suggesting COVID-era Twitter is about commentary rather than sharing links to official sources of information.
For those hoping to use the platform to map the pandemic, however, the number of geo-tagged tweets continues its sharp decline to just under 0.1% of the total and is falling. In fact, there is no statistical difference between the locations of geo-tagged tweets this year and those of the same time period last year, suggesting the surge in new Twitter users has come from the same places as before rather than spreading to new parts of the world.
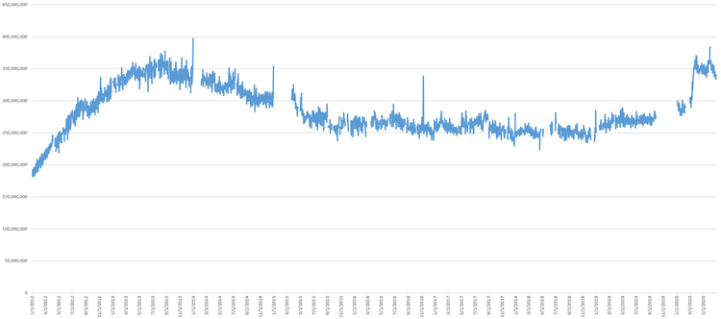
Could the platform have offered an early warning about the pandemic? Twitter is typically described as being faster than the news, offering much more rapid alerts to global events, but to what degree was this true for COVID-19? The timeline below compares the daily Z-scores (standard deviations from mean) of English-language tweets, U.S.-based Google searches and worldwide news coverage mentioning the outbreak over the first six months of this year.
In the initial burst of interest in late January, news media began increasing first, followed by online searches and then tweets. During the subsequent global lockdown wave, news and search again provided the earliest signals, followed by a vertical surge in tweets that quickly dropped off as search and news continued their increases. News coverage remained elevated while news and searches quickly dropped off, reflecting their short attention spans.
It is important to offer this caveat about the graphs above by noting that it is possible the company has made changes to its 1% sample dataset since last year, which could mean the graphs above no longer fully reflect the platform’s growth this year. Yet that is what makes these graphs all the more remarkable. The mere fact that Twitter doesn’t publish an official timeline of how many tweets per day are sent by how many users and remains silent when asked for this data reminds us just how little we know about the platforms that have increasing power over democracy here and elsewhere.
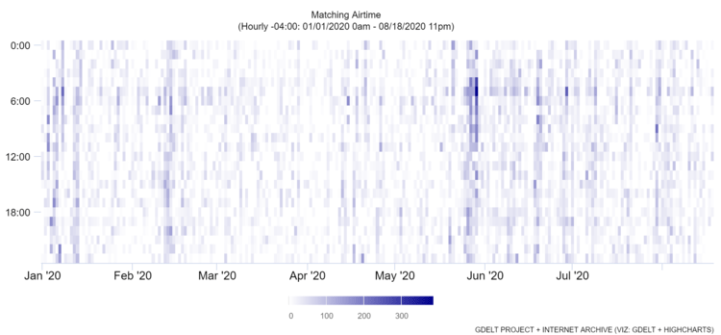
This is especially important given how influential Twitter has become over mainstream media. The “heatmap” below shows how many times “@realDonaldTrump” appeared somewhere on-screen across the combined reporting of BBC News, CNN, MSNBC and Fox News by hour (Eastern time zone) over the course of this year. Almost every hour of every day, the president’s social media handle made an appearance somewhere (this also includes a smaller number of Instagram and other posts that are also named @realDonaldTrump). Even those Americans who don’t use Twitter are being influenced by it.
In the end, the data remain fragmentary, incomplete and open to guesswork. In light of this, how can Congress ever hope to regulate a platform when it remains in the dark about such elemental matters?